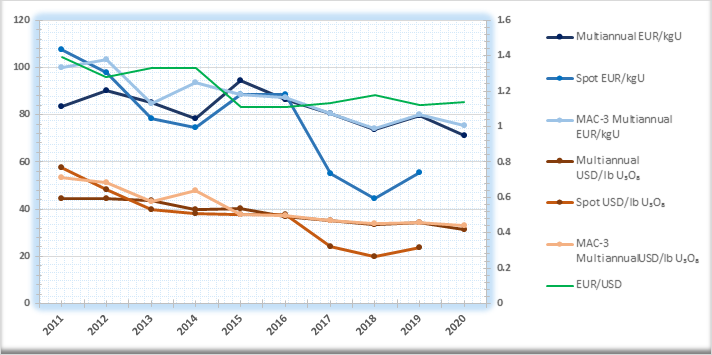
ESA indices 2011-2020
ESA indices 1980-2020
Year |
MultiannualEUR/kgU |
MultiannualUSD/lb U₃O₈ |
SpotEUR/kgU |
SpotUSD/lb U₃O₈ |
MAC-3EUR/kg U |
MAC-3USD/lb U₃O₈ |
Exchange rateEUR/USD |
|---|---|---|---|---|---|---|---|
|
2020 |
71.37 |
31.36 |
(***) |
(***) |
75.51 |
33.17 |
1.14 |
|
2019 |
79.43 |
34.2 |
55.61 |
23.94 |
80 |
34.45 |
1.12 |
|
2018 |
73.74 |
33.5 |
44.34 |
20.14 |
74.19 |
33.7 |
1.18 |
|
2017 |
80.55 |
35 |
55.16 |
23.97 |
80.5 |
34.98 |
1.13 |
|
2016 |
86.62 |
36.88 |
88.56 |
37.71 |
87.11 |
37.09 |
1.11 |
|
2015 |
94.3 |
40.24 |
88.73 |
37.87 |
88.53 |
37.78 |
1.11 |
|
2014 |
78.31 |
40.02 |
74.65 |
38.15 |
93.68 |
47.87 |
1.33 |
|
2013 |
85.19 |
43.52 |
78.24 |
39.97 |
84.66 |
43.25 |
1.33 |
|
2012 |
90.03 |
44.49 |
97.8 |
48.33 |
103.42 |
51.11 |
1.28 |
|
2011 |
83.45 |
44.68 |
107.43 |
57.52 |
100.02 |
53.55 |
1.39 |
|
2010 |
61.68 |
31.45 |
79.48 |
40.53 |
78.11 |
39.83 |
1.33 |
|
2009 |
55.7 |
29.88 |
77.96 |
41.83 |
63.49(**) |
34.06(**) |
1.39 |
|
2008 |
47.23 |
26.72 |
118.19 |
66.86 |
|
|
1.47 |
|
2007 |
40.98 |
21.6 |
121.8 |
64.21 |
|
|
1.37 |
|
2006 |
38.41 |
18.38 |
53.73 |
25.95 |
|
|
1.26 |
|
2005 |
33.56 |
16.06 |
44.27 |
21.19 |
|
|
1.24 |
|
2004 |
29.2 |
13.97 |
26.14 |
12.51 |
|
|
1.24 |
|
2003 |
30.5 |
13.27 |
21.75 |
9.46 |
|
|
1.13 |
|
2002 |
34 |
12.37 |
25.5 |
9.27 |
|
|
0.95 |
|
2001 |
38.25 |
13.18 |
21(*) |
7.23(*) |
|
|
0.9 |
|
2000 |
37 |
13.12 |
22.75 |
8.07 |
|
|
0.92 |
|
1999 |
34.75 |
14.25 |
24.75 |
10.15 |
|
|
1.07 |
|
1998 |
34 |
14.66 |
25 |
10.78 |
|
|
1.12 |
|
1997 |
34.75 |
15.16 |
30 |
13.09 |
|
|
1.13 |
|
1996 |
32 |
15.63 |
17.75 |
8.67 |
|
|
1.27 |
|
1995 |
34.75 |
17.48 |
15.25 |
7.67 |
|
|
1.31 |
|
1994 |
44.25 |
20.25 |
18.75 |
8.58 |
|
|
1.19 |
|
1993 |
47 |
21.17 |
20.5 |
9.23 |
|
|
1.17 |
|
1992 |
49.5 |
24.71 |
19.25 |
9.61 |
|
|
1.3 |
|
1991 |
54.75 |
26.09 |
19 |
9.05 |
|
|
1.24 |
|
1990 |
60 |
29.39 |
19.75 |
9.68 |
|
|
1.27 |
|
1989 |
69.25 |
29.35 |
28.75 |
12.19 |
|
|
1.1 |
|
1988 |
70 |
31.82 |
35.5 |
16.13 |
|
|
1.18 |
|
1987 |
73.5 |
32.5 |
39 |
17.25 |
|
|
1.15 |
|
1986 |
81.89 |
31 |
46.89 |
17.75 |
|
|
0.98 |
|
1985 |
99.77 |
29 |
51.09 |
15 |
|
|
0.76 |
|
1984 |
98 |
29.75 |
63.41 |
19.25 |
|
|
0.79 |
|
1983 |
90.51 |
31 |
67.89 |
23.25 |
|
|
0.89 |
|
1982 |
84.86 |
32 |
63.65 |
24 |
|
|
0.98 |
|
1981 |
77.45 |
33.25 |
65.22 |
28 |
|
|
1.12 |
|
1980 |
67.2 |
36 |
65.34 |
35 |
|
|
1.39 |
(*) The spot price for 2001 was calculated on the basis of an exceptionally low total volume of only some 330 tU under four transactions.
(**) ESA’s price method took account of the ESA ‘MAC-3’ new multiannual U₃O₈ price, which includes amended contracts from 2009 onwards.
(***) In 2020, the ESA U3O8 spot price was not calculated because there were not enough transactions (less than 3) to calculate the index.
Disclaimer: This information is made available for information purposes only, and ESA can take no legal responsibility for the use made of it. ESA ensures confidentiality and physical protection of the commercial data.
