
In the interest of its Treaty missions, ESA’s Statutes entrust it with a market observatory role. ESA has a duty to provide the Community with expertise, information and advice on any subject connected with the operation of the nuclear market.
To this end, ESA monitors the market in order to identify trends likely to affect the Union’s security of supply of nuclear materials and services. It aims to provide a wide range of information on nuclear market developments, as well as making reports on the EU market, average prices, total supply and demand etc. available to the public.
Through developing this web page, the Agency is seeking to inform market actors and observers about the current situation, market trends and, where appropriate, to highlight any possible shortcomings in the future.
The information refers, inter alia, to natural uranium price indices, including those calculated by ESA, to evaluations relating to the level of uranium supply and demand, and also to prominent events associated with the various stages of the nuclear fuel cycle in Europe and in the world.
Uranium EU Price: ESA Indices
ESA publishes on an annual basis three EU natural uranium price indices, based only on deliveries made to EU utilities or their procurement organisations under natural uranium and enriched uranium purchasing contracts in which the price is stated.
Since uranium is priced in different currencies, the fluctuation of the exchange rates influenced the level of the calculated price indices.
In order to establish a natural uranium price which excludes the conversion cost if the latter was not specified, ESA applied a rigorously calculated average conversion price, based on reported conversion prices and market information available.
In 2024:
- ESA spot U3O8 price: the weighted average of U3O8 prices paid by EU utilities for uranium delivered under spot contracts was calculated as:
EUR 132.32/kgU contained in U3O8 (11% decrease from EUR 149.28/kgU contained in 2023)
USD 55.09/lb U3O8 (9% decrease from USD 60.46/lb U₃O₈ in 2023)
- ESA multiannual U3O8 price: the weighted average of U3O8 prices paid by EU utilities for uranium delivered under multiannual contracts was calculated as:
EUR 142.26/kgU contained in U3O8 (23 % increase from EUR 115.79/kgU in 2023)
USD 59.23/lb U3O8 (23% increase from USD 48.16/lb U3O8 in 2023)
- ESA ‘MAC-3’ multiannual U3O8 price: the weighted average of U3O8 prices paid by EU utilities, only for multiannual contracts which were concluded or for which the pricing method was amended in the past three years and under which deliveries were made, was calculated as:
EUR 155.50/kgU contained in U3O8 (50 % increase from EUR 103.56/kgU in 2023)
USD 64.74/lb U3O8 (50% increase from USD 41.95/lb U3O8 in 2023)
ESA indices 2015-2024


ESA average prices for natural uranium
| Year | Multiannual contracts | Spot contracts | New multiannual contracts | Exchange rate | |||
| EUR/kgU | USD/lb U₃O₈ | EUR/kgU | USD/lb U₃O₈ | EUR/kgU | USD/lb U₃O₈ | EUR/USD | |
| 2024 | 142.26 | 59.23 | 132.32 | 55.09 | 155.50 | 64.74 | 1.08 |
Starting from 2011, ESA publishes a spot price indicator on a quarterly basis, provided that there are at least three spot contracts concluded by the EU utilities (excluding exchanges and loans), and that the price indicated is fixed and not expressed as a formula.
| Period | ESA quarterly spot uranium price EUR/kgU1 | ESA quarterly spot uranium price USD/lb U3O81 | Number of spot natural uranium contracts concluded by EU utilities (including purchases, sales, exchanges and loans)2 | Total number of contracts processed by ESA (including contracts, amendments and notifications on the front-end activities)2 |
|---|---|---|---|---|
| 2025 Q4 | 7 | 65 | ||
| 2025 Q3 | 8 | 74 | ||
| 2025 Q2 | 155.20 | 68.96 | 10 | 55 |
| 2025 Q1 | 0 | 72 | ||
| 2024 Q4 | 4 | 71 | ||
| 2024 Q3 | - | - | 3 | 55 |
| 2024 Q2 | - | - | 4 | 48 |
| 2024 Q1 | - | - | 3 | 85 |
| 2023 Q4 | - | - | 1 | 47 |
| 2023 Q3 | 142.85 | 59.80 | 3 | 57 |
| 2023 Q2 | - | - | 3 | 58 |
| 2023 Q1 | 124.59 | 51.42 | 5 | 62 |
| 2022 Q4 | ||||
| 2022 Q3 | ||||
| 2022 Q2 | ||||
| 2022 Q1 | - | - | 0 | 68 |
| 2021 Q4 | 86.07 | 37.95 | 1 | 61 |
| 2021 Q3 | - | - | 1 | 60 |
| 2021 Q2 | - | - | 1 | 60 |
| 2021 Q1 | 64.52 | 29.26 | 3 | 67 |
| 2020 Q4 | - | - | 4 | 69 |
| 2020 Q3 | - | - | 3 | 79 |
| 2020 Q2 | - | - | 4 | 65 |
| 2020 Q1 | - | - | 1 | 63 |
| 2019 Q4 | - | - | 4 | 84 |
| 2019 Q3 | - | - | 3 | 86 |
| 2019 Q2 | - | - | 2 | 55 |
| 2019 Q1 | - | - | 8 | 87 |
| 2018 Q4 | 62.39 | 27.39 | 8 | 75 |
| 2018 Q3 | - | - | 1 | 112 |
| 2018 Q2 | - | - | 2 | 65 |
| 2018 Q1 | - | - | 1 | 76 |
| 2017 Q4 | 47.33 | 21.43 | 6 | 84 |
| 2017 Q3 | 48.28 | 23.48 | 8 | 91 |
| 2017 Q2 | - | - | 1 | 74 |
| 2017 Q1 | - | - | 2 | 71 |
| 2016 Q4 | - | - | 1 | 118 |
| 2016 Q3 | - | - | 2 | 101 |
| 2016 Q2 | - | - | 0 | 55 |
| 2016 Q1 | - | - | 3 | 70 |
| 2015 Q4 | 85.51 | 36.02 | 6 | 109 |
| 2015 Q3 | - | - | 1 | 66 |
| 2015 Q2 | 86 | 36.56 | 4 | 83 |
| 2015 Q1 | - | - | 4 | 117 |
| 2014 Q4 | - | - | 5 | 76 |
| 2014 Q3 | - | - | 2 | 73 |
| 2014 Q2 | - | - | 5 | 67 |
| 2014 Q1 | 68.18 | 35.92 | 5 | 65 |
| 2013 Q4 | 66.18 | 34.65 | 15 | |
| 2013 Q3 | 71.2 | 36.27 | 7 | |
| 2013 Q2 | - | - | 0 | |
| 2013 Q1 | - | - | 2 | |
| 2012 Q4 | - | - | 2 | |
| 2012 Q3 | - | - | 0 | |
| 2012 Q1+Q2 | 97.53 | 48.64 | 6 | |
| 2011 Q4 | - | - | 6 | |
| 2011 Q3 | - | - | 4 | |
| 2011 Q2 | 101.17 | 56 | 6 | |
| 2011 Q1 | 118.8 | 62.51 | 6 |
1 prices converted with use of ECB reference exchange rate (www.ecb.europa.eu)
2 including purchases, sales, exchanges and loans
Disclaimer: This information is made available for information purposes only, and ESA can take no legal responsibility for the use made of it. ESA ensures confidentiality and physical protection of the commercial data.
Methodology
To calculate the quarterly average price (simple average), the original contract prices are converted, using the quarterly average exchange rate published by the European Central Bank, into EUR per kilogram of uranium in the chemical form U3O8.
To establish a price which excludes the conversion cost if it was not specified, ESA applies a calculated quarterly average conversion spot price indicator (based on conversion price indicators provided by consulting companies).
The date of signature by ESA is considered as the contract date.
In order to meet confidentiality rules, the indices are calculated only if there are three contracts with prices.
In 2024, 1 761 tU of fresh fuel was loaded into commercial reactors. It was produced using 12 120 tU of natural uranium and 11 tU of reprocessed uranium as feed, enriched with 9 166 tSW.
The fuel loaded into EU reactors had an average enrichment assay of 4.15%, with 81% falling between 3.54% and 4.76%. The average tails assay was 0.20%, with over 82% falling between 0.16% and 0.25%.
MOX (mixed oxide) fuel was used in several reactors in France and the Netherlands. MOX fuel loaded into nuclear power plants in the EU contained 6 934 kg plutonium in 2024, 45% more than in 2023. The use of MOX resulted in estimated savings of 605 tU, and 422 tSW, an increase of 42% and over 40% respectively since 2023 (see Annex 5). MOX fuel is produced by mixing plutonium recovered from spent fuel and depleted uranium obtained from the enrichment process. MOX fuel increases the availability of nuclear material, reduces the need for enrichment services and increases the security of supply.
The amount of natural uranium equivalent included in fuel loaded into reactors in 2024, including natural uranium feed, reprocessed uranium and savings from MOX fuel, totalled 12 736 tU.
Supply of natural uranium
IIn 2024, demand for natural uranium in the EU accounted for approximately 20% of global uranium requirements. EU utilities purchased a total of 13 667 tU in 118 deliveries under multiannual and spot contracts.
As in previous years, supplies under multiannual contracts were the main source to meet demand in the EU. Deliveries of natural uranium to EU utilities under multiannual contracts accounted for 12 623 tU (of which 12 414 tU with reported prices). The remaining 1 044 tU was purchased under spot contracts.
On average, the quantity of natural uranium delivered was 110 tU per delivery under multiannual contracts.
Since the start of Russia's war of aggression against Ukraine, EU utilities have been stockpiling nuclear materials and fuel to mitigate the risk of disruption of supply chains. Therefore, in 2024, they continued loading less material into reactors than they bought.
Origins of uranium
In 2024, natural uranium supplies to the EU continued to come from diverse sources. The origins of natural uranium supplied to EU utilities remained similar to 2023, though there were some changes in market share.
| Origin | Quantity | Share (%) | Change in quantities 2023/2024 (%) |
| Canada | 4 741 | 33.90% | -1.27% |
| Kazakhstan | 3 391 | 24.25% | 10.79% |
| Russia | 2 185 | 15.63% | -36.08% |
| Australia | 1 474 | 10.54% | 296.32% |
| Niger | 1 154 | 8.25% | -44.75% |
| China | 644 | 4.61% | 100.00% |
| Uzbekistan | 249 | 1.78% | -8.04% |
| Namibia | 146 | 1.04% | -73.41% |
| Malawi | 3 | 0.02% | 100.00% |
| EU | 0 | 0 | |
| Re-enriched tails | 0 | 0 | |
| Other (1) | 0 | 0 | |
| Total | 13 984 | 100 | -4.08% |
NB.: Because of rounding, totals may not add up
Four countries provided over 84% of all-natural uranium supplied to the EU in 2024, even though a slight reduction has been recorded.
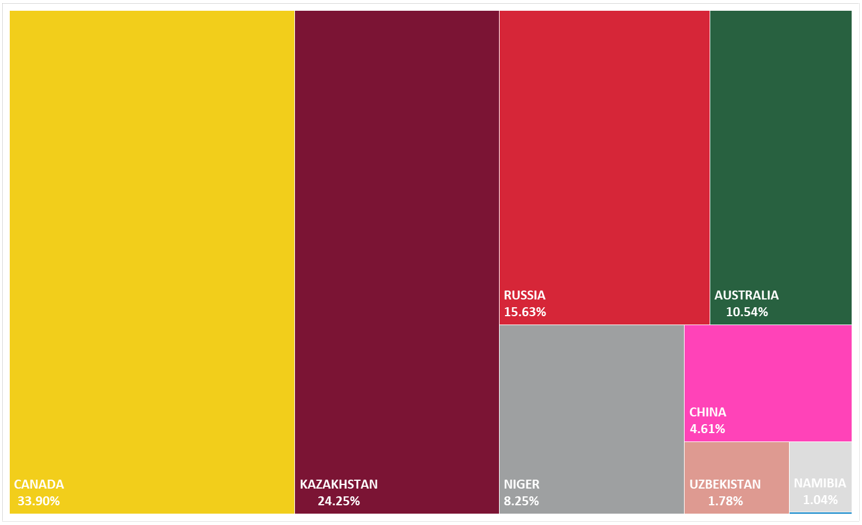
Origins of uranium delivered to EU utilities in 2024 (% share) - Euratom Supply Agency
Natural uranium produced in Commonwealth of Independent States (CIS) countries accounted for 41.66% of all-natural uranium delivered to EU utilities. CIS deliveries amounted to 5 825 tU in 2024 against 6 750 tU the year before. Natural uranium originating in non-CIS countries amounted to 8 012 tU in 2024, an increase compared to the 7 828 tU imported in 2023.
Similarly to the previous year, deliveries of uranium from Africa decreased sharply in 2024, reaching 1 303 tU compared to the 2 651 tU delivered in 2023.
Conversion
Conversion service deliveries to EU utilities were at the same level in 2024 as in 2023.
Under separate conversion contracts, 7 729 tU were converted, accounting for 58% of all service deliveries to EU utilities. The remaining 42%, or 5 778 tU, were delivered under other types of contracts (purchases of natural UF6, EUP, bundled contracts for fuel assemblies).
Provision of conversion services to EU utilities
| Converter | Quantity in 2023 (tU) | Share in 2023 (%) | Quantity in 2022 (tU) | Share in 2022 (%) | Change in quantities 2022/2023 (%) |
|---|---|---|---|---|---|
| Rosatom (Russia) | 2977 | 22.37 | 3543 | 26.51 | -15.97 |
| ConverDyn (US) | 2898 | 21.78 | 2448 | 18.32 | 18.39 |
| Orano (EU) | 2840 | 21.34 | 3834 | 28.69 | -25.94 |
| Cameco (Canada) | 2643 | 19.86 | 2525 | 18.90 | 4.66 |
| Unspecified | 1949 | 14.65 | 1013 | 7.58 | 92.33 |
| Total | 13306 | 100 | 13364 | 100 | -0.43 |
N.B.: Because of rounding, totals may not add up.
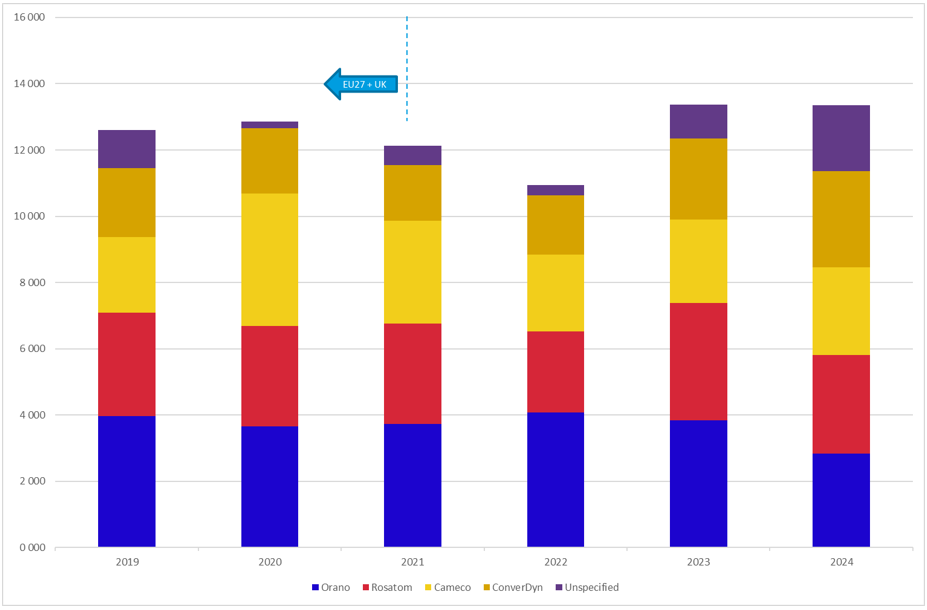
Supply of conversion services to EU utilities by provider, 2019-2024 (tU) Euratom Supply Agency
Enrichment
In 2024, enrichment service deliveries to EU utilities were 15% lower than in 2023, with nuclear power plant operators opting for an average enrichment assay of 4.19% and an average tails assay of 0.20%.
Origin of enrichment services to EU utilities in 2024
| Enrichment origin | EUP | Uranium feed | Quantities in | SW share in | Quantities in | SW share in |
| tU 2024 | 2024 (tU) | 2024 (tSW) | 2024 (%) | 2023 (tSW) | 2023 (%) | |
| EU | 1 042 | 7 932 | 6 654 | 63.95 | 6 728 | 54.88 |
| Russia | 356 | 2 844 | 2 450 | 23.55 | 4 647 | 37.90 |
| Other | 182 | 1 423 | 1 301 | 12.50 | 885 | 7.22 |
| TOTAL | 1 580 | 12 199 | 10 405 | 100 | 12 260 | 100 |
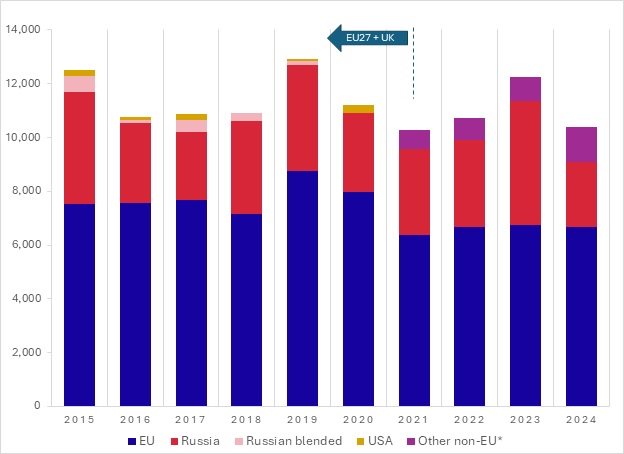
(*) other non-EU - starting from 2021
The main fuel manufacturers are also reactor vendors, usually supplying the initial cores and early reloads for reactors of their own design. The largest fuel fabrication capacity can be found in the EU (Germany, Spain, France, Sweden and the United Kingdom), Russia and the United States.
The market is very competitive. As a result, a trend of continuously improving fuel design has emerged, focusing on enhanced burnups and improved performance.
Most EU utilities have access to at least two alternative fuel fabricators. In stark contrast with the situation elsewhere, the dependence on a single design and supplier of fuel for VVER reactors remains a significant vulnerability to the security of supply.
The Euratom Supply Agency notes the efforts by operators and producers to design, license, create fabrication capacity and contract alternative fuel for VVER reactors. Some countries dependent on VVER type reactors have made first steps to diversify the fuels and signed already contracts with alternative suppliers or are in negotiation process.
At the end of 2024, the natural uranium equivalent in inventories owned by EU utilities totalled 39 898 tU. The inventories comprised uranium at different stages of the nuclear fuel cycle (natural uranium, in-process for conversion, enrichment, fuel fabrication and fresh fuel), stored at EU or other nuclear facilities.
The changes in the aggregate natural uranium inventories do not necessarily reflect the difference between the total natural uranium equivalent loaded into reactors and uranium delivered to EU utilities, as the level of inventories is subject to movements of loaned material, sales of uranium to third parties and one-off national transfers of material.
Based on average annual EU gross uranium reactor requirements (11 731 tU per year), uranium inventories are sufficient to fuel the nuclear power reactors of EU utilities for more than three reloads on average. This average conceals a wide range, although all utilities keep a sufficient quantity of inventories for at least one reload.
A further analysis of the inventories of EU utilities shows that most of these inventories are located in the EU. However, some are located outside the EU and a small fraction for future delivery is stored at unknown locations.